Financial dashboards for businesses are necessary for routinely evaluating daily business operations. Financial dashboard metrics ensure that enterprises remain on course. Thus, it is one of the most important aspects of any enterprise.
Businesses can invest in a competent financial management program to ensure that the best inventory management practices are followed through various methods.
Financial management is integral to supply chain management, production, customer relations, and other business activities. For example, stock inventory management aims to have the appropriate products for sale. Besides, real-time inventory tracking effectively streams operations as a whole.
The dashboards assist the business in having the appropriate products available at the proper time. It prevents products from being out of stock and funds from being wasted on surplus inventory. In addition, stock inventory management ensures that all products are sold promptly to prevent spoilage. Moreover, it saves millions.
What is a Financial Dashboard?
A financial dashboard displays critical financial metrics and KPIs required to track your business’s financial health.
They are helpful for CFOs, VPs, and financial managers who must regularly monitor the company’s financial performance.
Financial dashboards collect, consolidate, analyze, and report financial data points from various systems and processes. Also, it provides a centralized control point for your financial team and facilitates better decision-making.
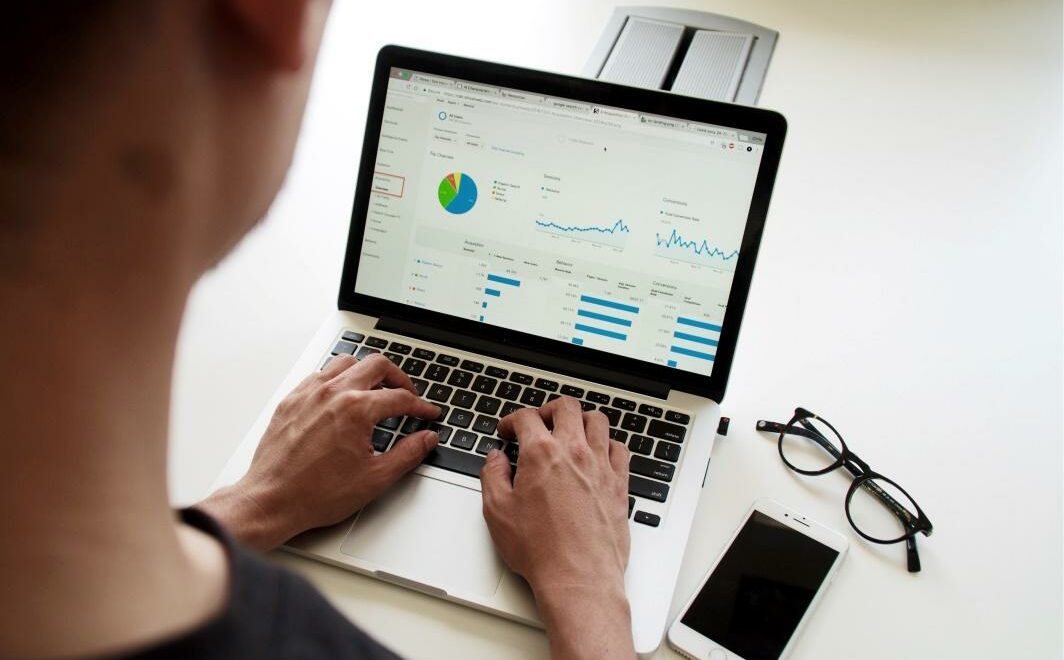
A dashboard from a cloud-based financial planning and analysis software tool is shown in the snapshot below:
Critical Capabilities of a Financial Dashboard
The most effective financial dashboard goes beyond basic visualization. It makes it simple to leverage robust finance analytics and explore and analyze data in a unified manner within the dashboard.
A financial dashboard is a vital tool for any business owner or manager. It provides a clear picture of the company’s financial health and performance. Many different metrics can be tracked on a financial dashboard, but some are more critical than others.
For the most part, a financial dashboard is used to keep track of the company’s cash flow. This is done by tracking the business’s top revenue and expense items.
There are some other key metrics that should also be tracked for a comprehensive financial dashboard.
Here are the top 11 metrics to track on your financial dashboard:
11 Metrics to Include In a Finance Dashboard.
If you need clarification on what a dashboard looks and feels like, look at this sample finance dashboard. This article, on the other hand, focuses on the what — specifically, what metrics must be included in an indispensable finance dashboard.
Let’s look at each of the below-listed financial metrics.
1. Current Working Capital
The financial dashboard begins with a summary of your current working capital, which consists of your current assets and liabilities.
As a business owner, you should track your company’s current working capital in your financial dashboard. This metric is important because it measures your company’s short-term financial health and ability to pay its debts. By tracking your current working capital, you can make informed decisions about allocating your resources and managing your finances.
For example, if you have a substantial amount of working capital, you can invest and expand; conversely, if your current assets are less than your current liabilities, your risk of bankruptcy increases.
2. Total Customers and Demographics
Total customers is a metric that measures the number of people or businesses purchasing your product or service. This number can give you an idea of how popular your product is and how well it’s selling. It’s also an excellent way to track growth over time.
Demographics is another important metric to track. This includes age, gender, income, location, and so on. This data can help you understand your customer base and what they’re looking for. It can also help you target your marketing efforts more effectively.
3. Revenue
This is the most important metric to track on your financial dashboard. It shows how much money your company is bringing in and is a good indicator of overall growth. A key revenue component is an average revenue per user (ARPU). This metric shows how much each user brings in for your company. It’s important to track this metric to see if your business model is sustainable.
4. Gross Profit Margin
It measures the manufacturing performance of your company over time. It indicates how efficiently you are managing your labor and production materials. Falling gross margins are problematic because they suggest that your operations become unfeasible as the cost of producing products or services exceeds their revenue.
5. Net Burn or Burn Rate
Net burn, also known as burn rate, is the amount of cash your company spends each month. This metric is important because it shows how quickly your company uses its cash reserves. If your net burn is too high, it could put your business at risk of running out of money.
6. Debt-to-Equity Ratio
This metric measures the amount of debt your company has compared to the amount of equity. A high debt-to-equity ratio means that your company is heavily indebted and may be at risk of defaulting on its loans.
On the other hand, a low debt-to-equity ratio indicates that your company has a strong financial position and can easily cover its debts.
To calculate your debt-to-equity ratio, divide your total liabilities by your total equity. If your ratio exceeds 1, your liabilities are greater than your equity. This is not a good sign, as it indicates that your company uses more debt than it has in assets.
7. Operating Cash Flow.
It measures the total revenue generated by a company’s regular operations. This metric will ensure that your business has sufficient cash after funding daily operations and expenses. A favorable operating cash flow is indicative of a thriving business.
8. Accounts Receivable Turnover
This metric measures the rate at which you receive payment for goods or services sold on credit. It provides greater insight into your customers’ ability to pay by revealing how quickly they repay the credit extended to them
9. Operating Profit Margin
It measures your company’s income after deducting selling, general, and administrative expenses, also known as overhead costs. When calculating the operating profit margin, expenses such as the cost of employing salespeople and advertising are considered.
10. Total Asset Turnover
It measures the effectiveness with which your company generates revenue from its tangible and intangible assets, such as cash, computers, and intellectual property. The greater your company’s turnover ratio, the better its financial performance.
11. Cash Flows
This metric tells you how much cash is coming into and going out of your business. It’s important to keep a close eye on cash flow to ensure no liquidity issues.
Have you selected your key metrics? Here’s what to do next.
Once you have chosen the metrics for your financial dashboard, take the following steps to make it a reality:
Consolidate your data sources
Determine the data sources the dashboard will use to populate your metrics. Multiple departments, including sales, marketing, production, and administration, typically contribute data to financial metrics.
You can consolidate historical transactions from your current enterprise resource planning (ERP) system. But if your finance department is still using Excel, you should create a separate, labeled spreadsheet for the final dataset you wish to display on your dashboard.
Input analysis from your income statement, balance sheet, cash flow statement, budget and forecast, and any additional financial statements. They yield insightful results if the data supporting the visualizations on a dashboard for financial reporting is accurate, complete, and relevant. Unlock the full potential of your financial data if you haven’t already by automating critical accounting tasks to prepare better and source your data.
Use the right tools and technology
Data visualization is an evolving field with many software tools offering effective designs and user-friendly interfaces. Invest in tools that can integrate seamlessly with your existing technology stack.
Best Financial Dashboards for Businesses – In Summary
As businesses grow, so do the number of metrics they need to track. While some metrics are more important, all companies should track at least 11 key financial metrics.
The most important metric for any business is profit. This metric tells you whether or not your business is generating enough revenue to cover its costs. Other critical financial metrics include cash flow, revenue, expenses, and inventory turnover.
Businesses should also track their accounts receivable and accounts payable balances. These metrics can help you manage your cash flow and pay bills promptly. Additionally, businesses should monitor their customer churn and employee turnover rates. These metrics can help you identify problems within your company and take steps to fix them.
Finally, businesses should track their market share and customer satisfaction levels.
Action Step
It’s time to switch to Financli if you’re prepared to see the core of your business operations and functions with granular clarity. Request a demonstration to discover how you can transform your business, free up precious time, and increase your profits.
Financli, The financial dashboard software, allows you to evaluate your projects in minutes. It will enable you to view your financial data in one location to make more informed decisions about your project based on the dashboard’s in-depth insights. In addition, Financli facilitates the management of project evaluations.